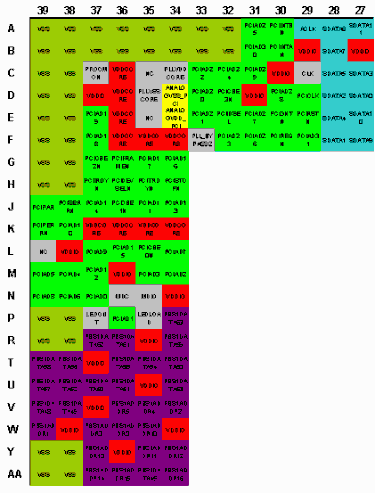
Many semiconductor manufacuturers use Microsoft’s Excel spreadsheet as a general purpose tool for defining the ball matrix on BGA packages. Because Excel is universally available and understood, data about the ball assignment vs. signal is often transmitted in this fashion. On the other hand, package design tools rely on ascii lists of nets, balls and pins to read and write the design data. A tool that can read an ASCII list and import it into Excel would be useful to product engineers who need to document a BGA’s layout. |
![]() |
The ASCII FileThe ascii data consists of two or more columns of data. For a ball matrix the columns we are interested in are the ball JEDEC’s label and the signal name associated with that ball. For example: A1 VSS A2 VDD A3 CONTROL HIGH A4 CLOCK LINE 1 . . |
Such a file can be output from a variety of package design tools after the design is complete. We’d like to be able to take this list and generate an Excel spreadsheet called a ball map that looks like the above image. |
![]() |
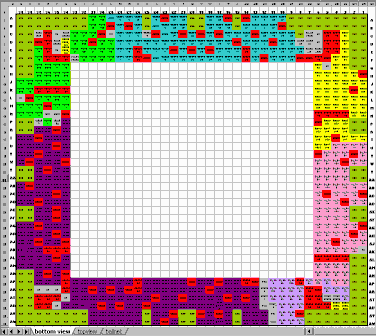
The Excel LayoutThe Ballmap program creates a cell for each ball pad. The signal name of the ball pad is listed in the center of the cell. The JEDEC labels are arranged outside the array on both top/bottom and left/right. Three worksheets are generated - a top view, a bottom view, and a table of balls vs. netnames. Color CodingColor coding is quite useful in visualizing the device. Colors are assigned to nets in the Ballmap program. Wildcard matching can be used so that a family of related nets are colored similarly. Font ControlThe user sets the size of the fonts used for the net names and also sets the size of the fonts for the JEDEC labels that run across the top and sides of the ball map. |
|
Installation | Download | Revision History | Price |