Running xgdsplot


xgdsplot195x355.gif


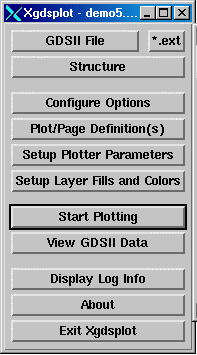
xgdsplot main menu

This page describes the basic procedure for plotting a GDSII file using xgdsplot. The product allows you to select the GDSII file and the cell you wish to plot. The different steps allow you to pick various plotting options like layers and colors/fills to use, page size, plot format etc..


select_gds232x427.gif


STEP 1

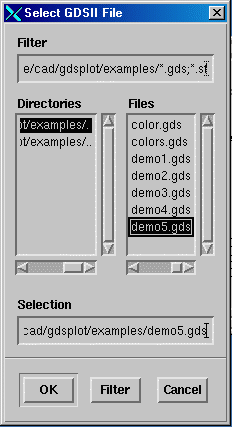
Start xgdsplot from the directory where the GDSII file is located. Either add the xgdsplot/bin directory to your path or just specify the full path to xgdsplot The select GDSII file menu will pop up and you can select the file you wish to plot. If you don't see your file, you probably want to change the Filter on top to reflect the correct extension.


configure450x612.gif

STEP 2

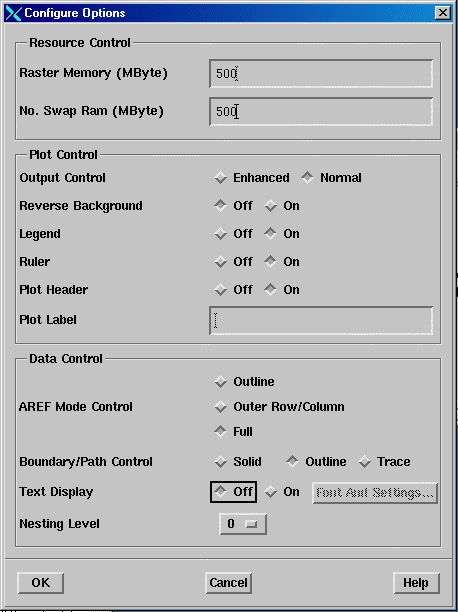
From the main menu, click on Configure Options button to open the Configuration menu.
The default values in the picture are good. You can change some of the settings like the ruler, header, legend etc..


STEP 3

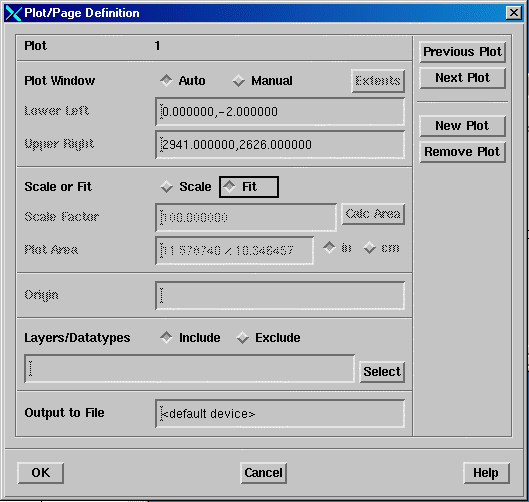
From the main menu, Click on the Plot Page Definition button. In this menu you can select whether you want to plot the full extents of the chip (Auto) or a window (Manual).
You can select whether you want to Fit to Page or plot to scale - when selecting a scale, you can click on the Calculate Area to find the page size.
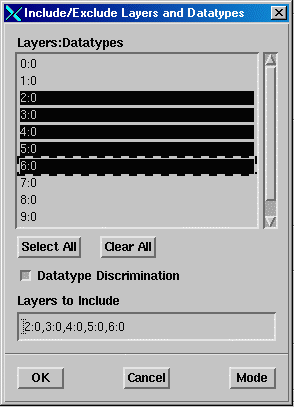
Last, you can choose to plot all layers (default) or click on Select to choose the layers to plot as shown in the menu below.

plot_page529x502.gif


plot_page_layers294x407.gif


STEP 4

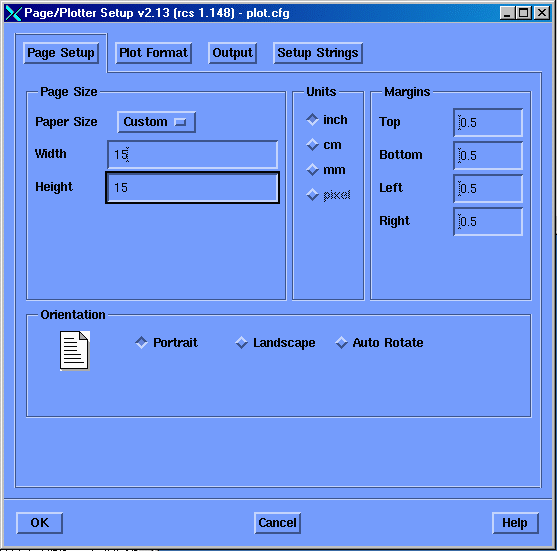
From the Main Menu, Click on Setup Plotter Parameter. The first menu allows you to set the page size you want and the rotation.
page_setup557x551.gif

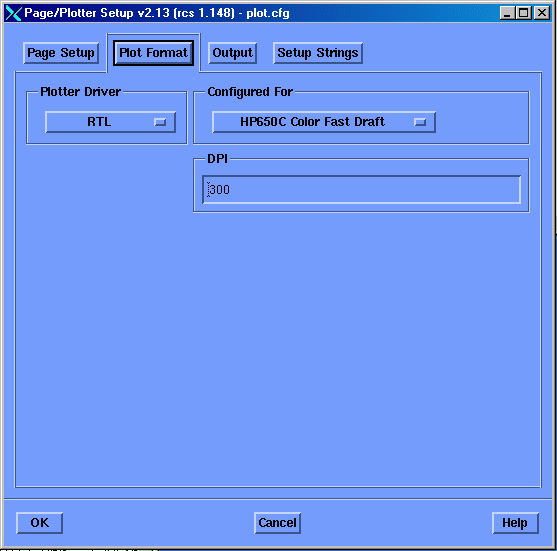
Click on the Plot Format to set the raster format. For all HP Inkjet Plotters we recommend using the RTL driver.
Other available formats are PostscriptII (for PDF), TIFF, and BMP.
page_setup_format557x551.gif


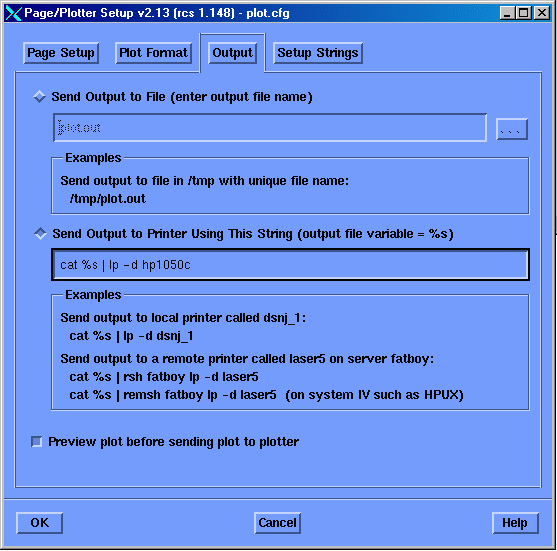
Click on the Output to select whether you want the plot to go to a file or directly to the plotter. Make sure to put the correct plotter name on the command line.
In this menu you can also activate the Preview Plot option. At the end of the plot, you will be able to preview the plot file before sending it to the plotter. It is great way to check your plot before printing it.
page_setup_output557x551.gif


STEP 5

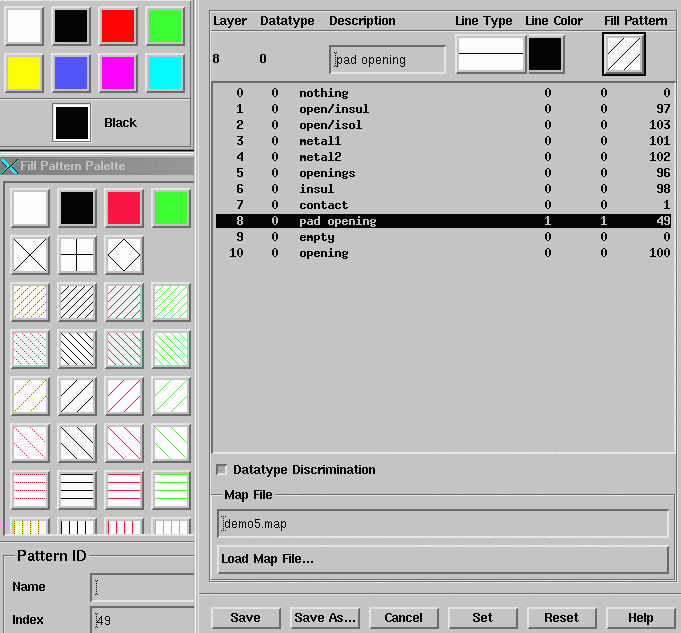
From the Main Menu, Click on Setup Layer Fills and Colors. This menu will allow you to create the MAP file with the outline type, outline color, layer name, and fill assignment for the layers.
This information will be used by the plotting software and will be plotted at the top of the plot if the Legend was on.

fills681x633.gif


STEP 6

From the Main Menu, Click on Start Plotting. This can take a few minutes. It depends on your file size, page size, and amount of RAM you have.
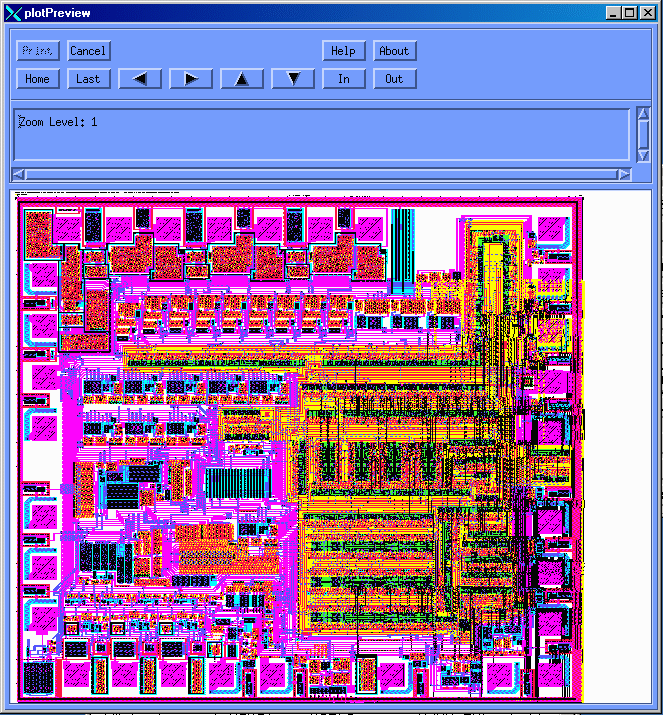
At the end of the plot, the Preview plot will come up and you will be able to look at the plot. If it is ok, you can hit the Print to send the plot file to the plotter.

preview_plot663x715.gif